August 15, 2022
Adding a hexbin layer to a mapbox map
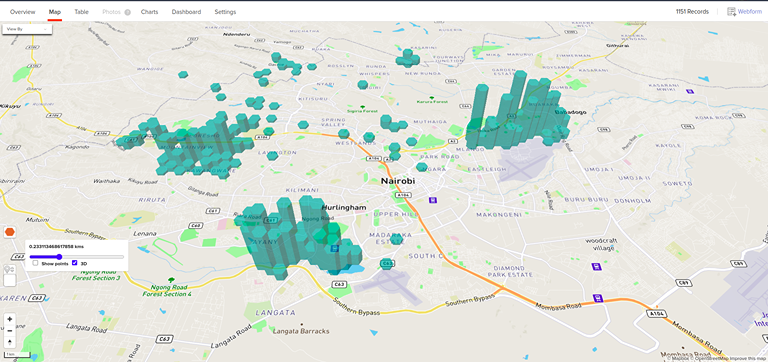
Adding 3D hexbin layer to a mapbox map

3D hexbins provide an interesting way to explore and visualize the geographical distribution of data points on a map.
Here are the steps you can take to implement 3D hexbins using Mapbox GL JS and Turf.js using geojson data (in ClojureScript)
Find the bounds of your geojson data
First, we need to find the bounds the geojson data for which we would like to render hexbins.
(require '["@mapbox/geojson-extent" :as GeojsonExtent])

(def bounds (GeojsonExtent (clj->js geojson-data)))
Create a hexgrid within the map bounds using turf.js's hexgrid
(require '["@turf/hex-grid" :as hex-grid])

(def hexgrid
(hex-grid/default
    (clj->js bounds)
    (or hexbin-radius min-radius)
    #js {:units "kilometers"}))
Collect all the points you'd like to render in the hexgrid using turf.js's collect
(require '["@turf/collect" :as collect])

(def hex-bin-data
    (collect/default
        hexgrid
        (-> geojson-data
            clj->js
            explode/default)
        "id" ;; this is useful if your geojson has a property called `id`
        "points"))
Finally, we need to remove/prune all the points that do not have any geodata collected in the previous step from the grid
(defn count-hexbin-points
  "Counts points collected into hexbins."
  [hexbins]
  (for [{{:keys [points]} :properties, :as features} (:features hexbins)
        :let [point-count (count points)]]
    (when (pos? point-count)
      (assoc features :properties {:point-count (* 100 point-count)}))))

(def clean-hexbin-data
    (assoc hex-bin-data
        :features (remove nil?
                         (count-hexbin-points hex-bin-data))))
Render resulting geodata on map
We use the fill-extrusion layer type coupled with data driven styling for the height of each bin
In the following code, we accomplish this in a delarative maner using React Map GL's Source and Layer components
[:> Source {:id "hexbin", :type "geojson", :data clean-hexbin-data}
             [:> Layer
              {:id "hexbin-layer",
               :type "fill",
               :source "hexbin",
               :paint {"fill-extrusion-base" 1,
                         "fill-extrusion-color" "#088",
                         "fill-extrusion-opacity" 0.6,
                         "fill-extrusion-height" ["get" "point-count"]}}]]